Introduction
How It Works
Code Chunks
Inline Code
Code Languages
Parameters
Tables
Markdown Basics
Output Formats
Notebooks
Slide Presentations
Dashboards
Websites
Interactive Documents
Cheatsheets
Dashboards
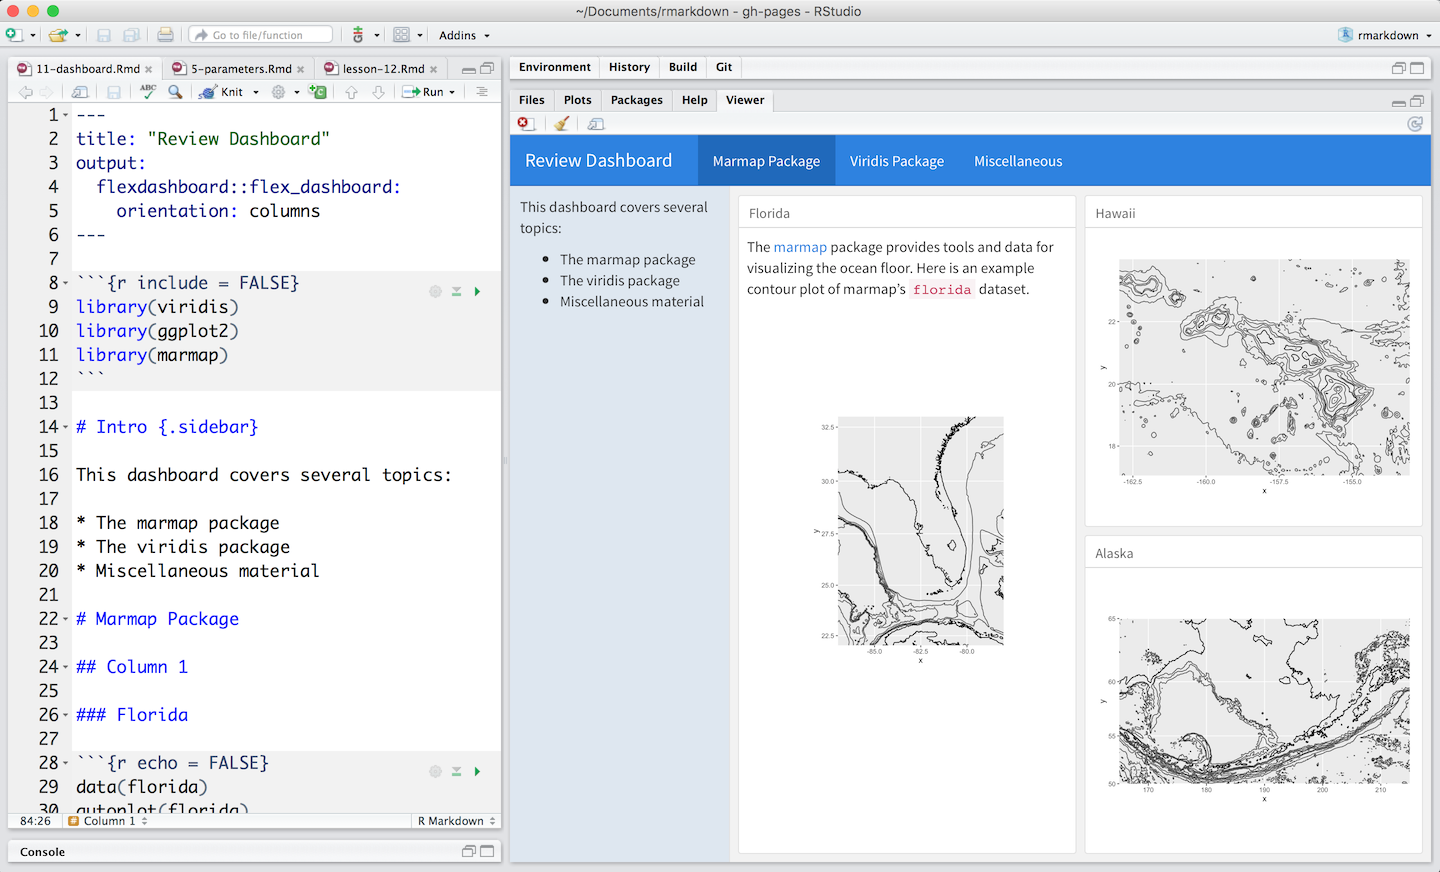
Dashboards are a useful way to communicate large amounts of information visually and quickly. Create one with the flexdashboard::flex_dashboard output format, as in the .Rmd file below:

Flexdashboard makes it easy to organize your content into a visual layout:
- Each Level 1 Header (
#) begins a new page in the dashboard. - Each Level 2 Header (
##) begins a new column. - Each Level 3 Header (
###) begins a new box.
You can further modify elements with attributes, as in the {.sidebar} above.
Flexdashboard also provides simple tools for creating tabsets, value boxes, and gauges. Learn more about flexdashboard at flexdashboard: Easy interactive dashboards for R.